Prometheus and Grafana
Prometheus is an open-source monitoring and alerting toolkit designed for reliability and scalability. It collects and stores time-series metrics from systems, applications, and services. Grafana is a visualisation and analytics platform that integrates seamlessly with Prometheus and other data sources. It allows users to create interactive dashboards, set up alerts, and analyse performance trends in real time. Together, Prometheus and Grafana form a robust monitoring stack- Prometheus handles data collection and storage, while Grafana provides visual insights and alerting.
Prometheus
Prometheus will be installed on the head node (node1). To install Prometheus, first, create a dedicated user for Prometheus:
sudo useradd --system --no-create-home --shell /usr/sbin/nologin prometheus
id prometheus
Then download, extract, and install Prometheus on your system, then link the binaries to your system path so they can be run easily from anywhere in the terminal.
cd /tmp
wget https://github.com/prometheus/prometheus/releases/download/v3.5.0/prometheus-3.5.0.linux-amd64.tar.gz

sudo tar -xvf /tmp/prometheus-3.5.0.linux-amd64.tar.gz -C /opt/

sudo ln -s /opt/prometheus-3.5.0.linux-amd64/prometheus /usr/local/bin/prometheus
sudo ln -s /opt/prometheus-3.5.0.linux-amd64/promtool /usr/local/bin/promtool
You can verify the installation by checking the versions:
prometheus --version
promtool --version
Then create the necessary directories and set the appropriate permissions:
sudo mkdir -p /etc/prometheus
sudo mkdir -p /var/lib/prometheus
sudo chown -R prometheus:prometheus /etc/prometheus /var/lib/prometheus
Next, create the Prometheus configuration file at /etc/prometheus/prometheus.yml:
global:
    scrape_interval: 15s

scrape_configs:
    - job_name: 'node_exporters'
    static_configs:
            - targets: ['node1:9100', 'node2:9100', 'node3:9100', 'node4:9100', 'node5:9100', 'node6:9100', 'node7:9100']
scrape_interval: Sets how often Prometheus collects (or scrapes) metrics from all configured targets.
job_name: Labels this scrape job (node_exporters ). This is helpful for organising and filtering metrics later.
static_configs: Lists fixed, manually defined targets.
targets: Specifies the hosts and ports to scrape. Each target here is a node running Node Exporter - a Prometheus agent that exposes system metrics like CPU, memory, and disk usage on port 9100.
Now set the ownership and permissions for the configuration file:
sudo chown prometheus:prometheus /etc/prometheus/prometheus.yml
sudo chmod 644 /etc/prometheus/prometheus.yml
Then create a systemd service file, /etc/systemd/system/prometheus.service, for Prometheus with the following conent
[Unit]
Description=Prometheus
Wants=network-online.target
After=network-online.target

[Service]
User=prometheus
Group=prometheus

ExecStart=/usr/local/bin/prometheus \
    --config.file=/etc/prometheus/prometheus.yml \
    --storage.tsdb.path=/var/lib/prometheus \
    --web.listen-address=:9090

Restart=on-failure

[Install]
WantedBy=multi-user.target
Description: A short description of the service (shown when you run systemctl status prometheus).
Wants: Ensures the network is up before Prometheus starts, but doesn’t strictly block startup if it fails.
After: Makes Prometheus start after the system’s network is ready.
Finally, reload the systemd daemon and start the Prometheus service:
sudo systemctl daemon-reload
sudo systemctl enable --now prometheus
sudo systemctl status prometheus
Node Exporter
Node Exporter is a lightweight agent used with Prometheus to collect detailed hardware and OS-level metrics from Linux systems. It runs on each node and exposes system information such as CPU usage, memory consumption, disk I/O, filesystem statistics, and network performance via an HTTP endpoint (usually :9100/metrics). In a monitoring setup, Prometheus periodically scrapes these metrics from Node Exporter, helping administrators track system health, detect performance issues, and analyse resource utilisation across nodes in a cluster or HPC environment.
Node Exporter has to be installed on login (node2), compute (node3, node4, node5), and storage node (node6, node7). So the next steps have to be done on all these nodes.
First, create a dedicated user for Node Exporter:
sudo useradd --system --no-create-home --shell /usr/sbin/nologin node_exporter
id node_exporter
Then download and install Node Exporter:
cd /tmp
wget https://github.com/prometheus/node_exporter/releases/download/v1.10.2/node_exporter-1.10.2.linux-amd64.tar.gz

sudo tar -xvf /tmp/node_exporter-1.10.2.linux-amd64.tar.gz -C /opt/

sudo ln -s /opt/node_exporter-1.10.2.linux-amd64/node_exporter /usr/local/bin/node_exporter
Verify the installation by checking the version:
/usr/local/bin/node_exporter --version
Then create a systemd service file /etc/systemd/system/node_exporter.service for Node Exporter:
[Unit]
Description=Node Exporter
After=network.target

[Service]
User=node_exporter
Group=node_exporter
Type=simple
ExecStart=/usr/local/bin/node_exporter
Restart=always
RestartSec=5s

[Install]
WantedBy=multi-user.target
This systemd service file configures Node Exporter to run automatically as a background service on system startup. It starts after the network is available, runs securely under the dedicated node_exporter user, and executes the Node Exporter binary to expose system metrics (usually on port 9100). The service is set to automatically restart if it fails, with a short 5-second delay between attempts, ensuring continuous availability for Prometheus monitoring.
Finally, reload the systemd daemon and start the Node Exporter service:
sudo systemctl daemon-reload
sudo systemctl enable --now node_exporter
sudo systemctl status node_exporter
Grafana
To install Grafana, first, import the Grafana GPG key:
cd /tmp
wget -q -O gpg.key https://rpm.grafana.com/gpg.key
sudo rpm --import gpg.key
Then create the Grafana repository file /etc/yum.repos.d/grafana.repo:
[grafana]
name=grafana
baseurl=https://rpm.grafana.com
repo_gpgcheck=1
enabled=1
gpgcheck=1
gpgkey=https://rpm.grafana.com/gpg.key
sslverify=1
sslcacert=/etc/pki/tls/certs/ca-bundle.crt
Once the repository is set up, install Grafana:
sudo dnf install grafana -y
grafana-server -v
Then start and enable the Grafana service:
sudo systemctl enable --now grafana-server
sudo systemctl status grafana-server
Dashboard
Now that everything is set up, access the Grafana web interface by navigating to the following URL in your web browser on the local system.
http://<ip-of-management-node>:3000
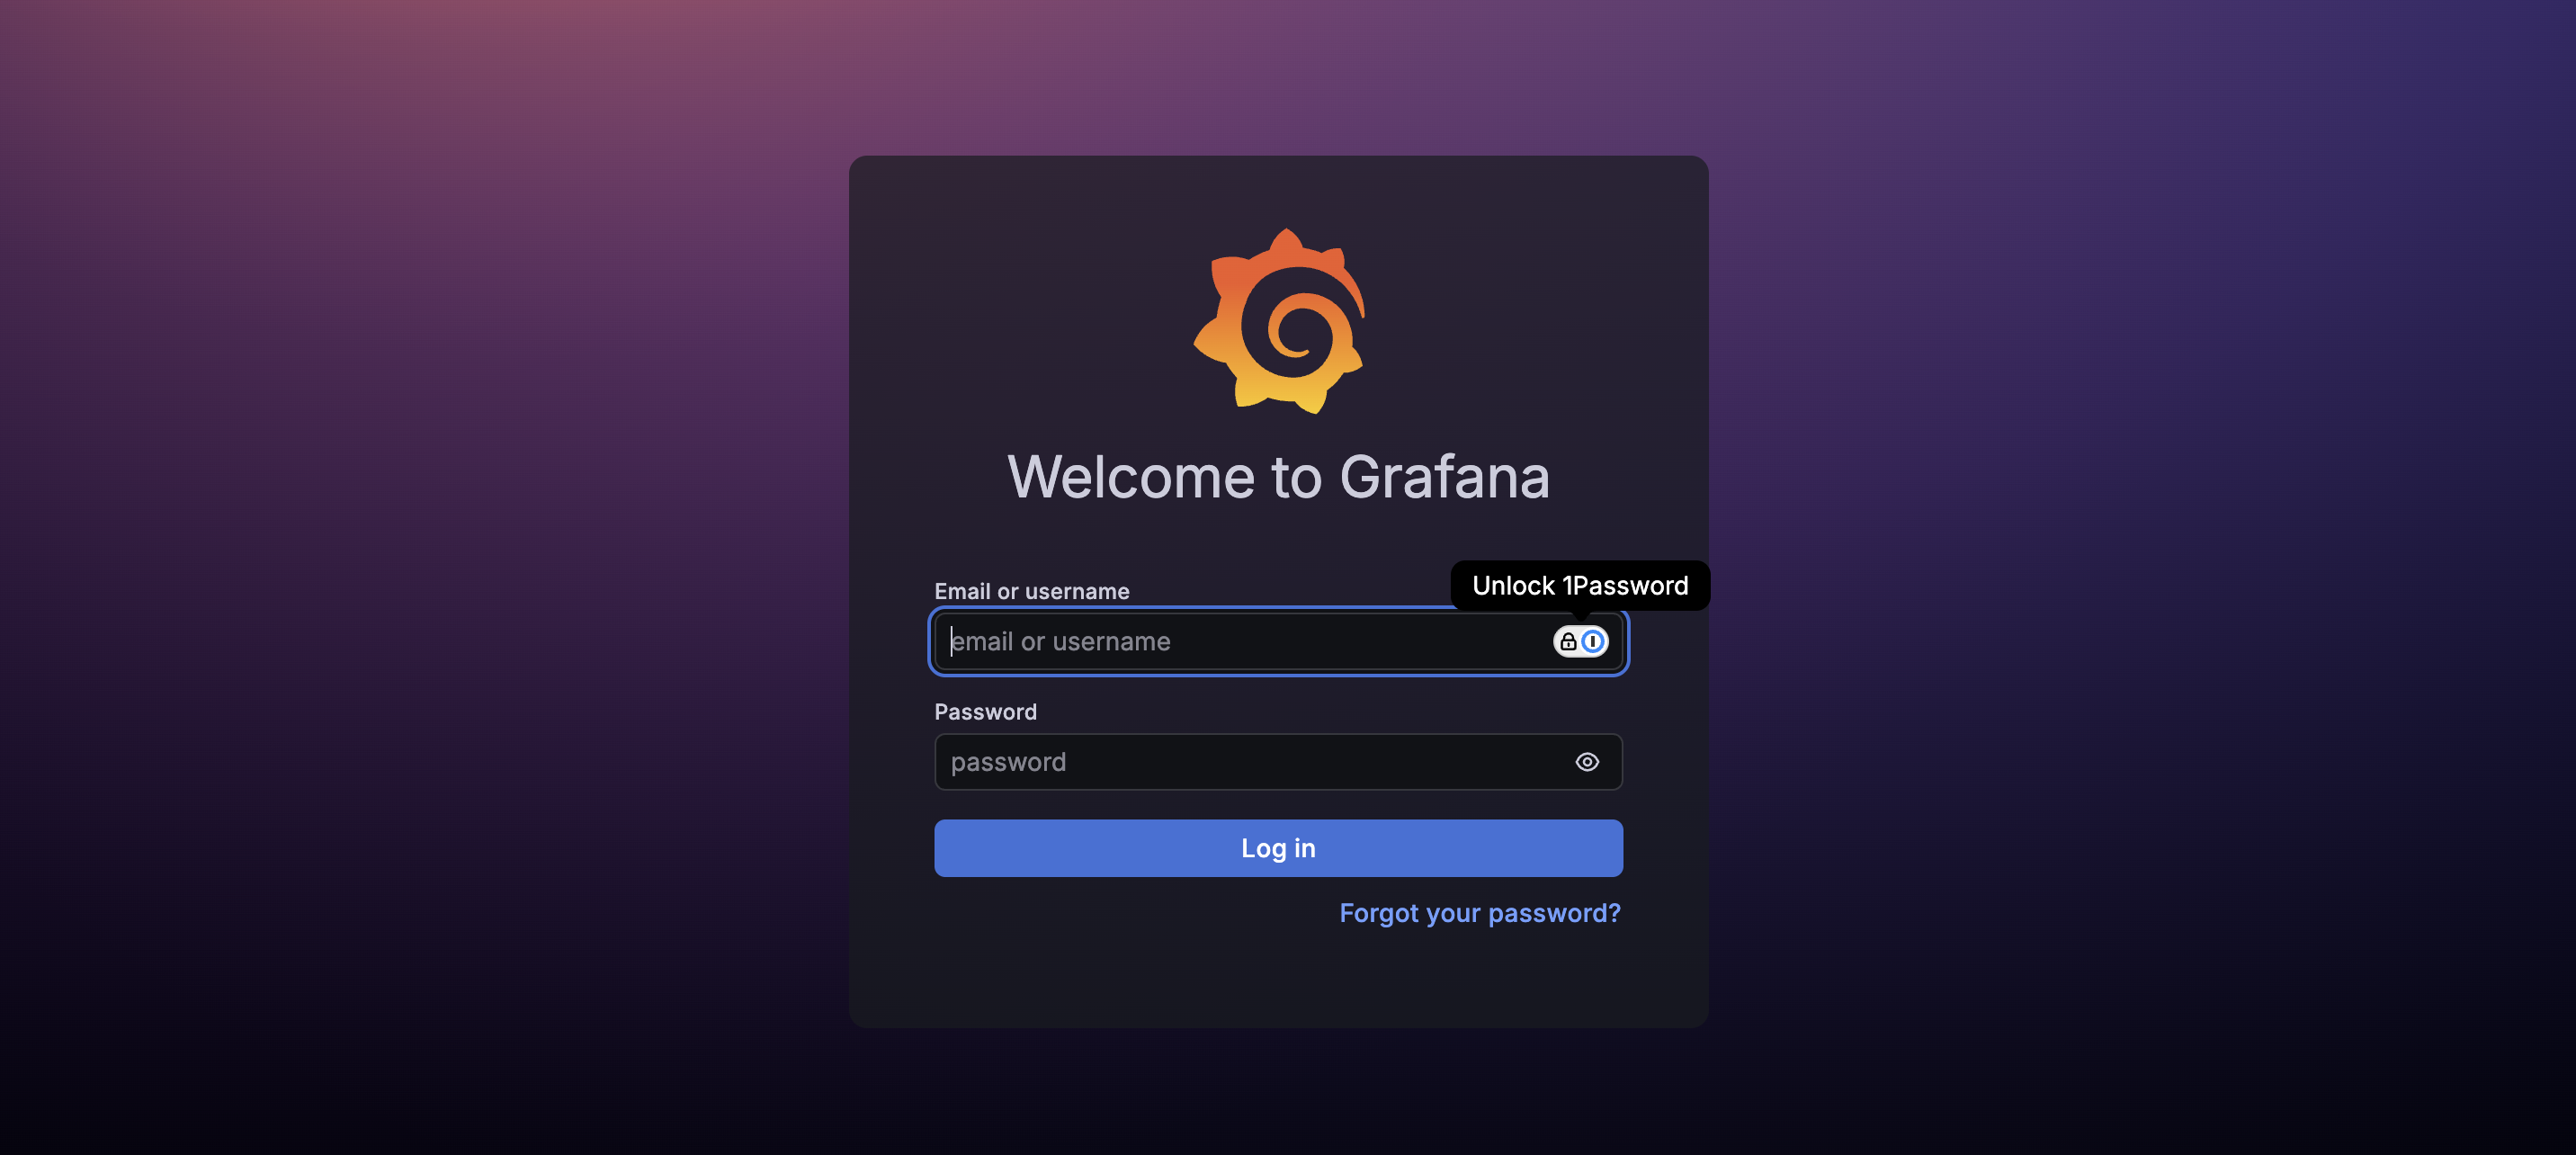
The default username and password are both admin. Once logged in, you have the following landing page.
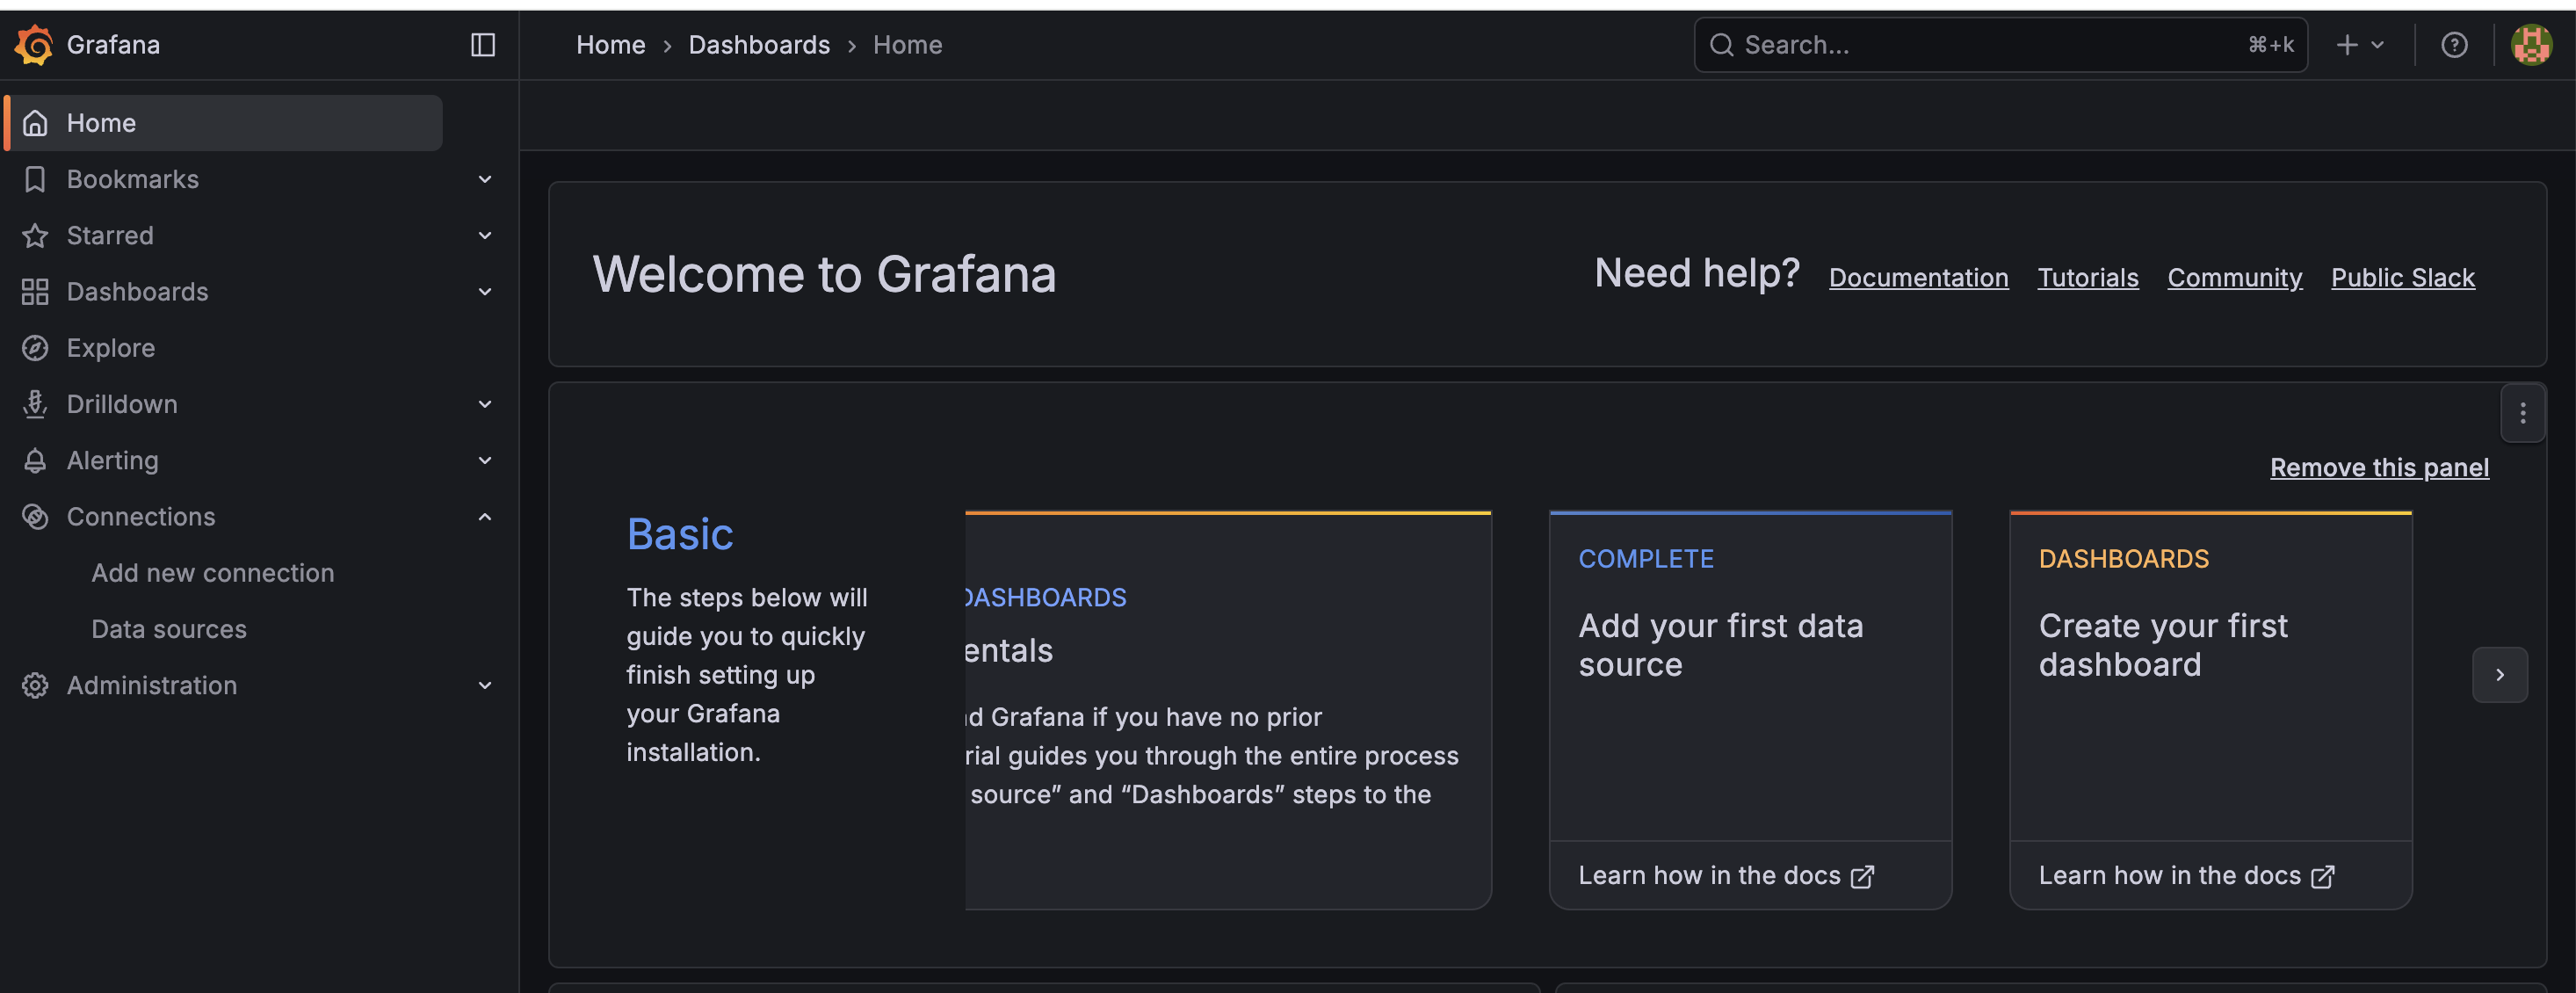
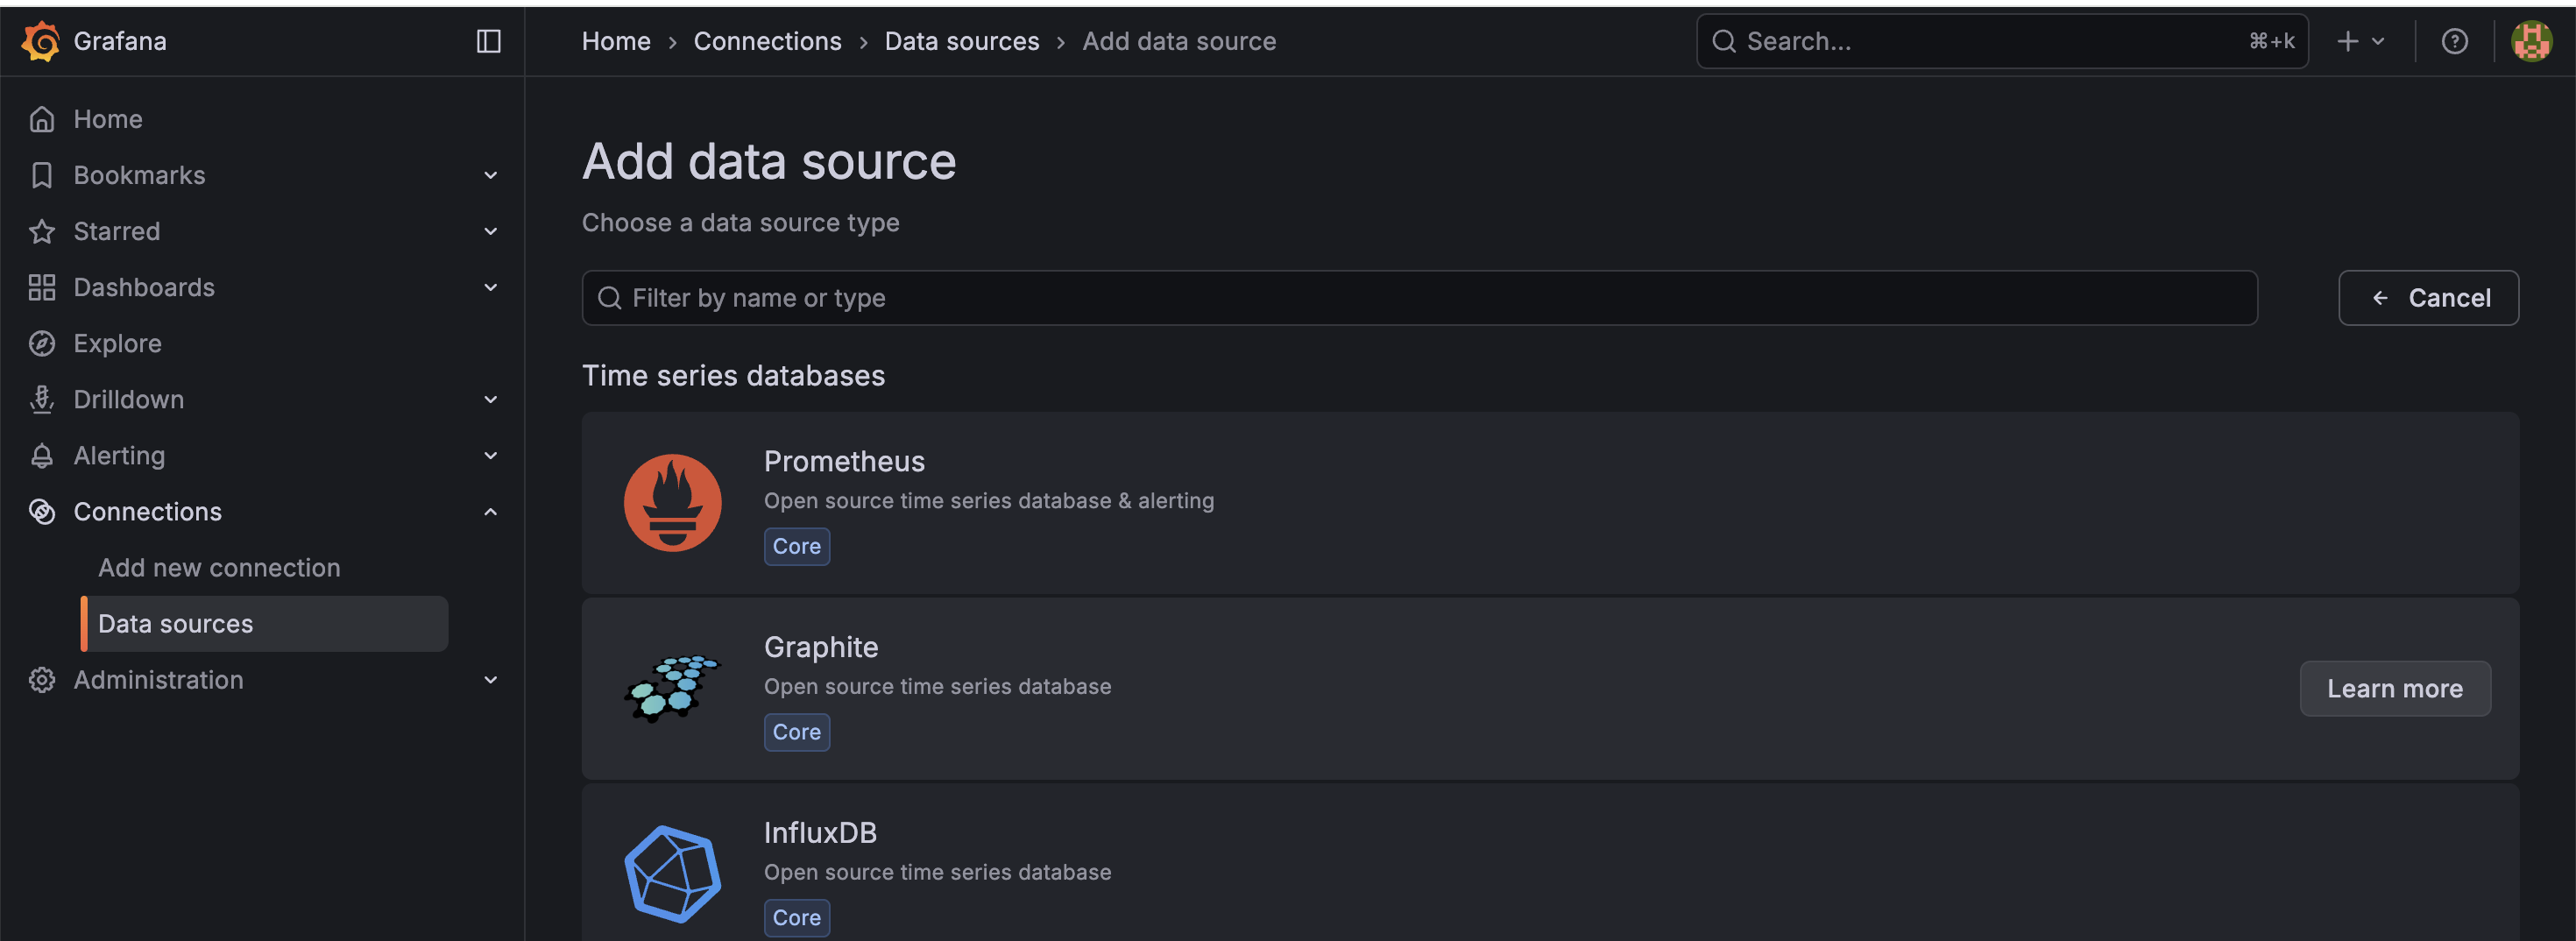
The next step is to select a data source for Grafana. In our case, the datasource is Prometheus.
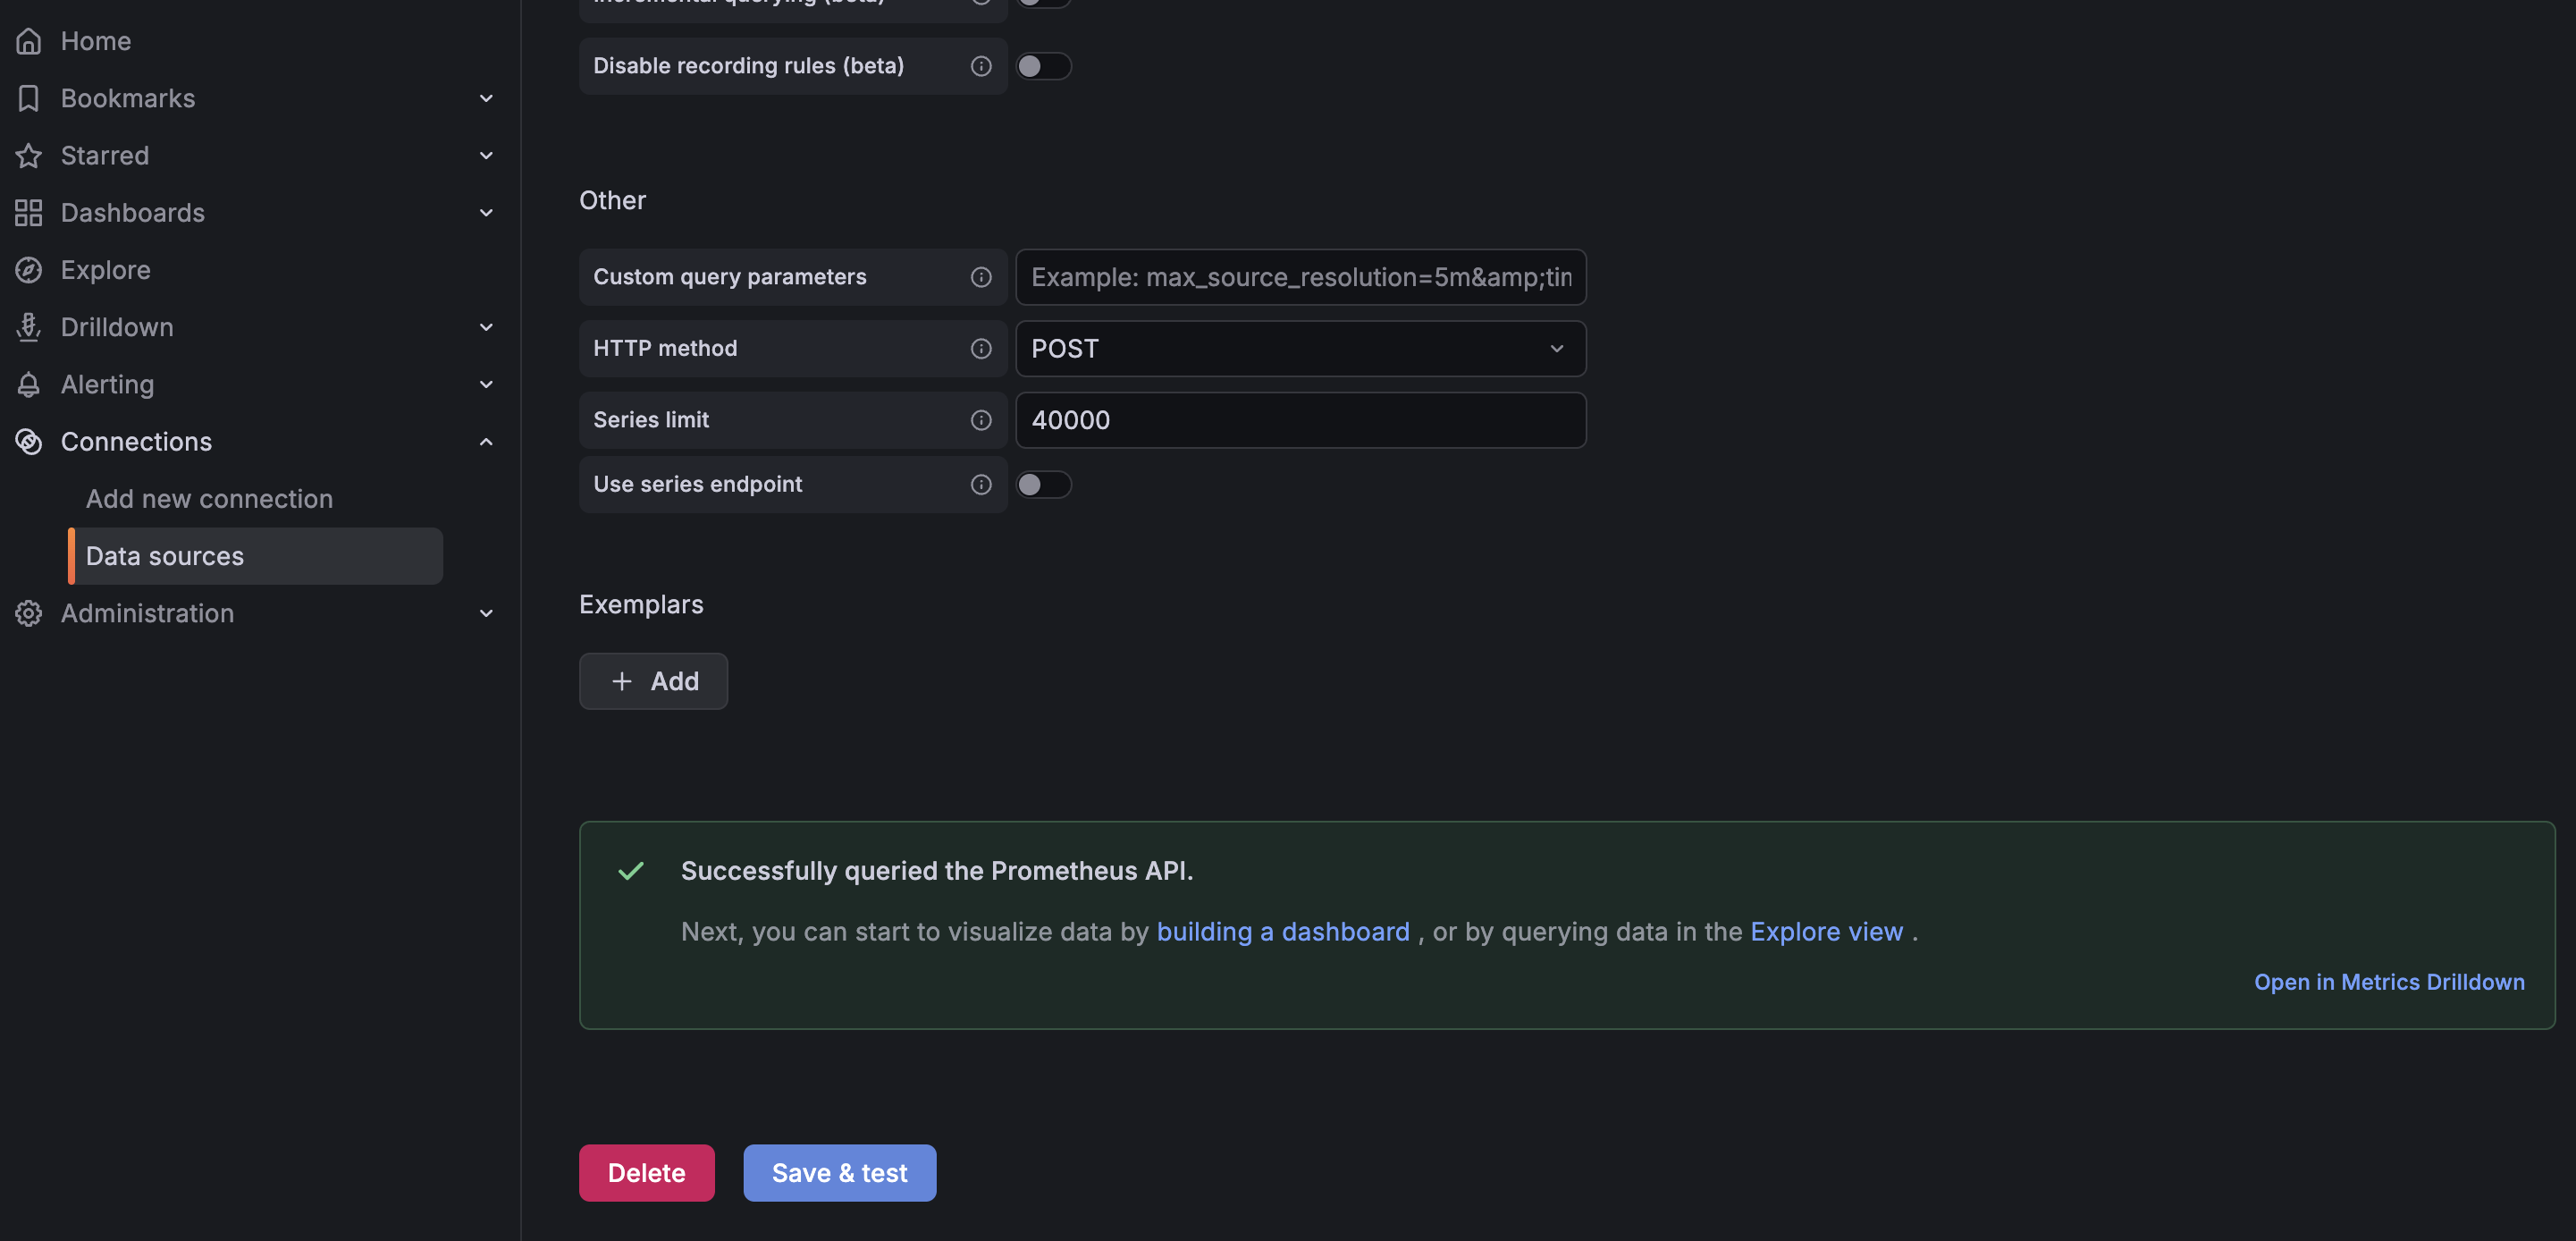
Within the Prometheus data source, we have to specify the Prometheus server. In our case, Grafana and Prometheus are installed on Node1, so we can point to the Prometheus server using localhost.
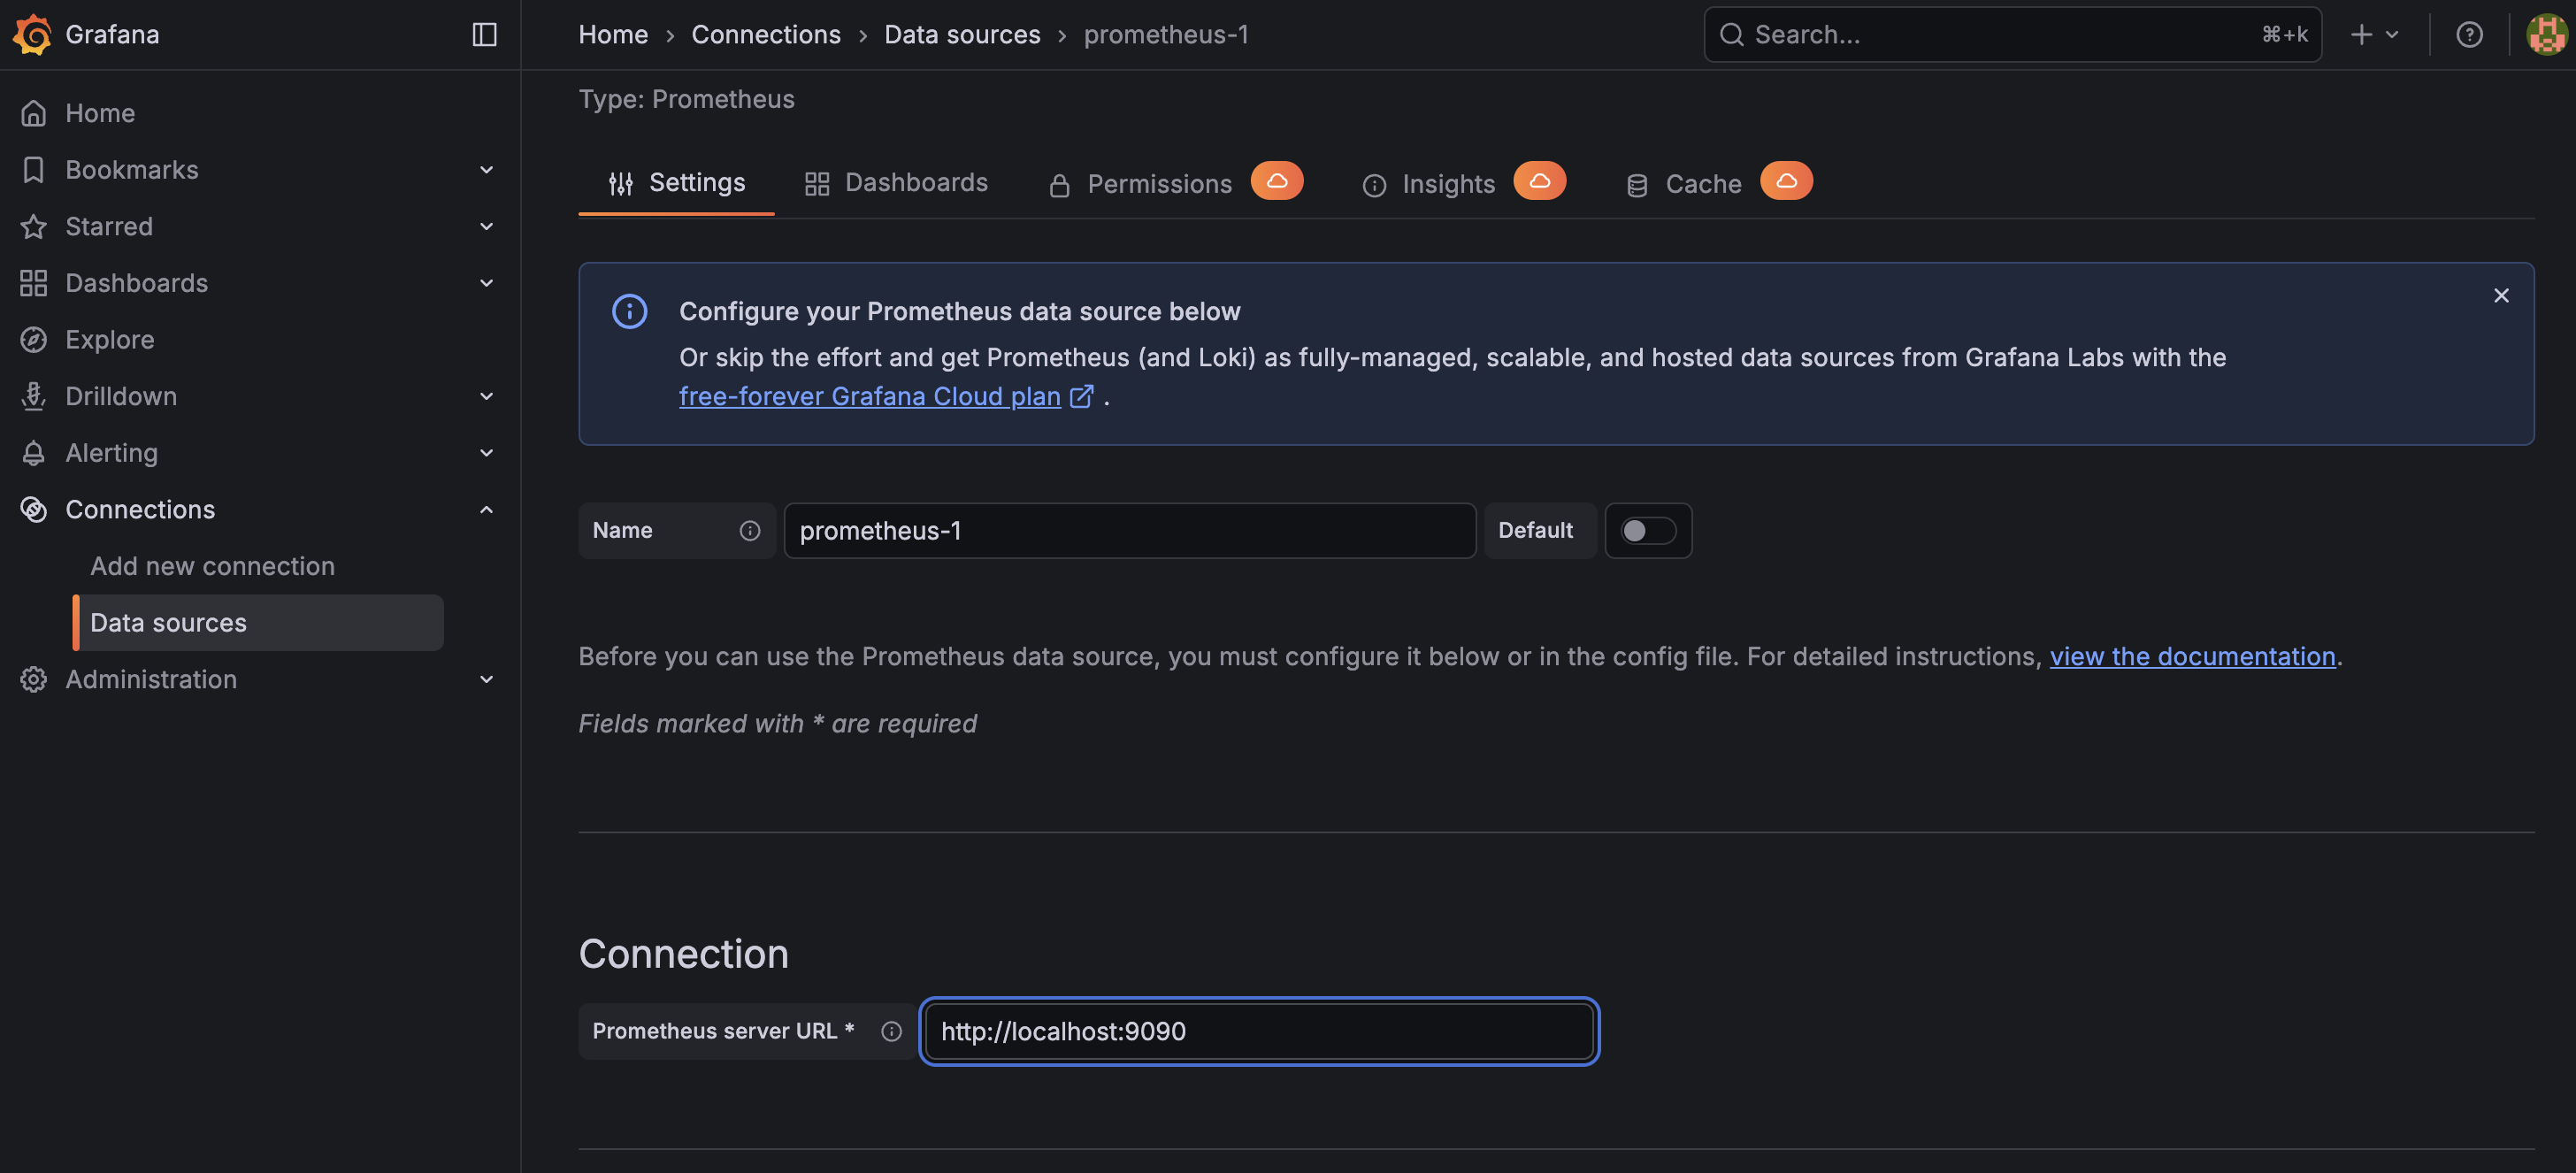
Once this is set, you can save the datasource.
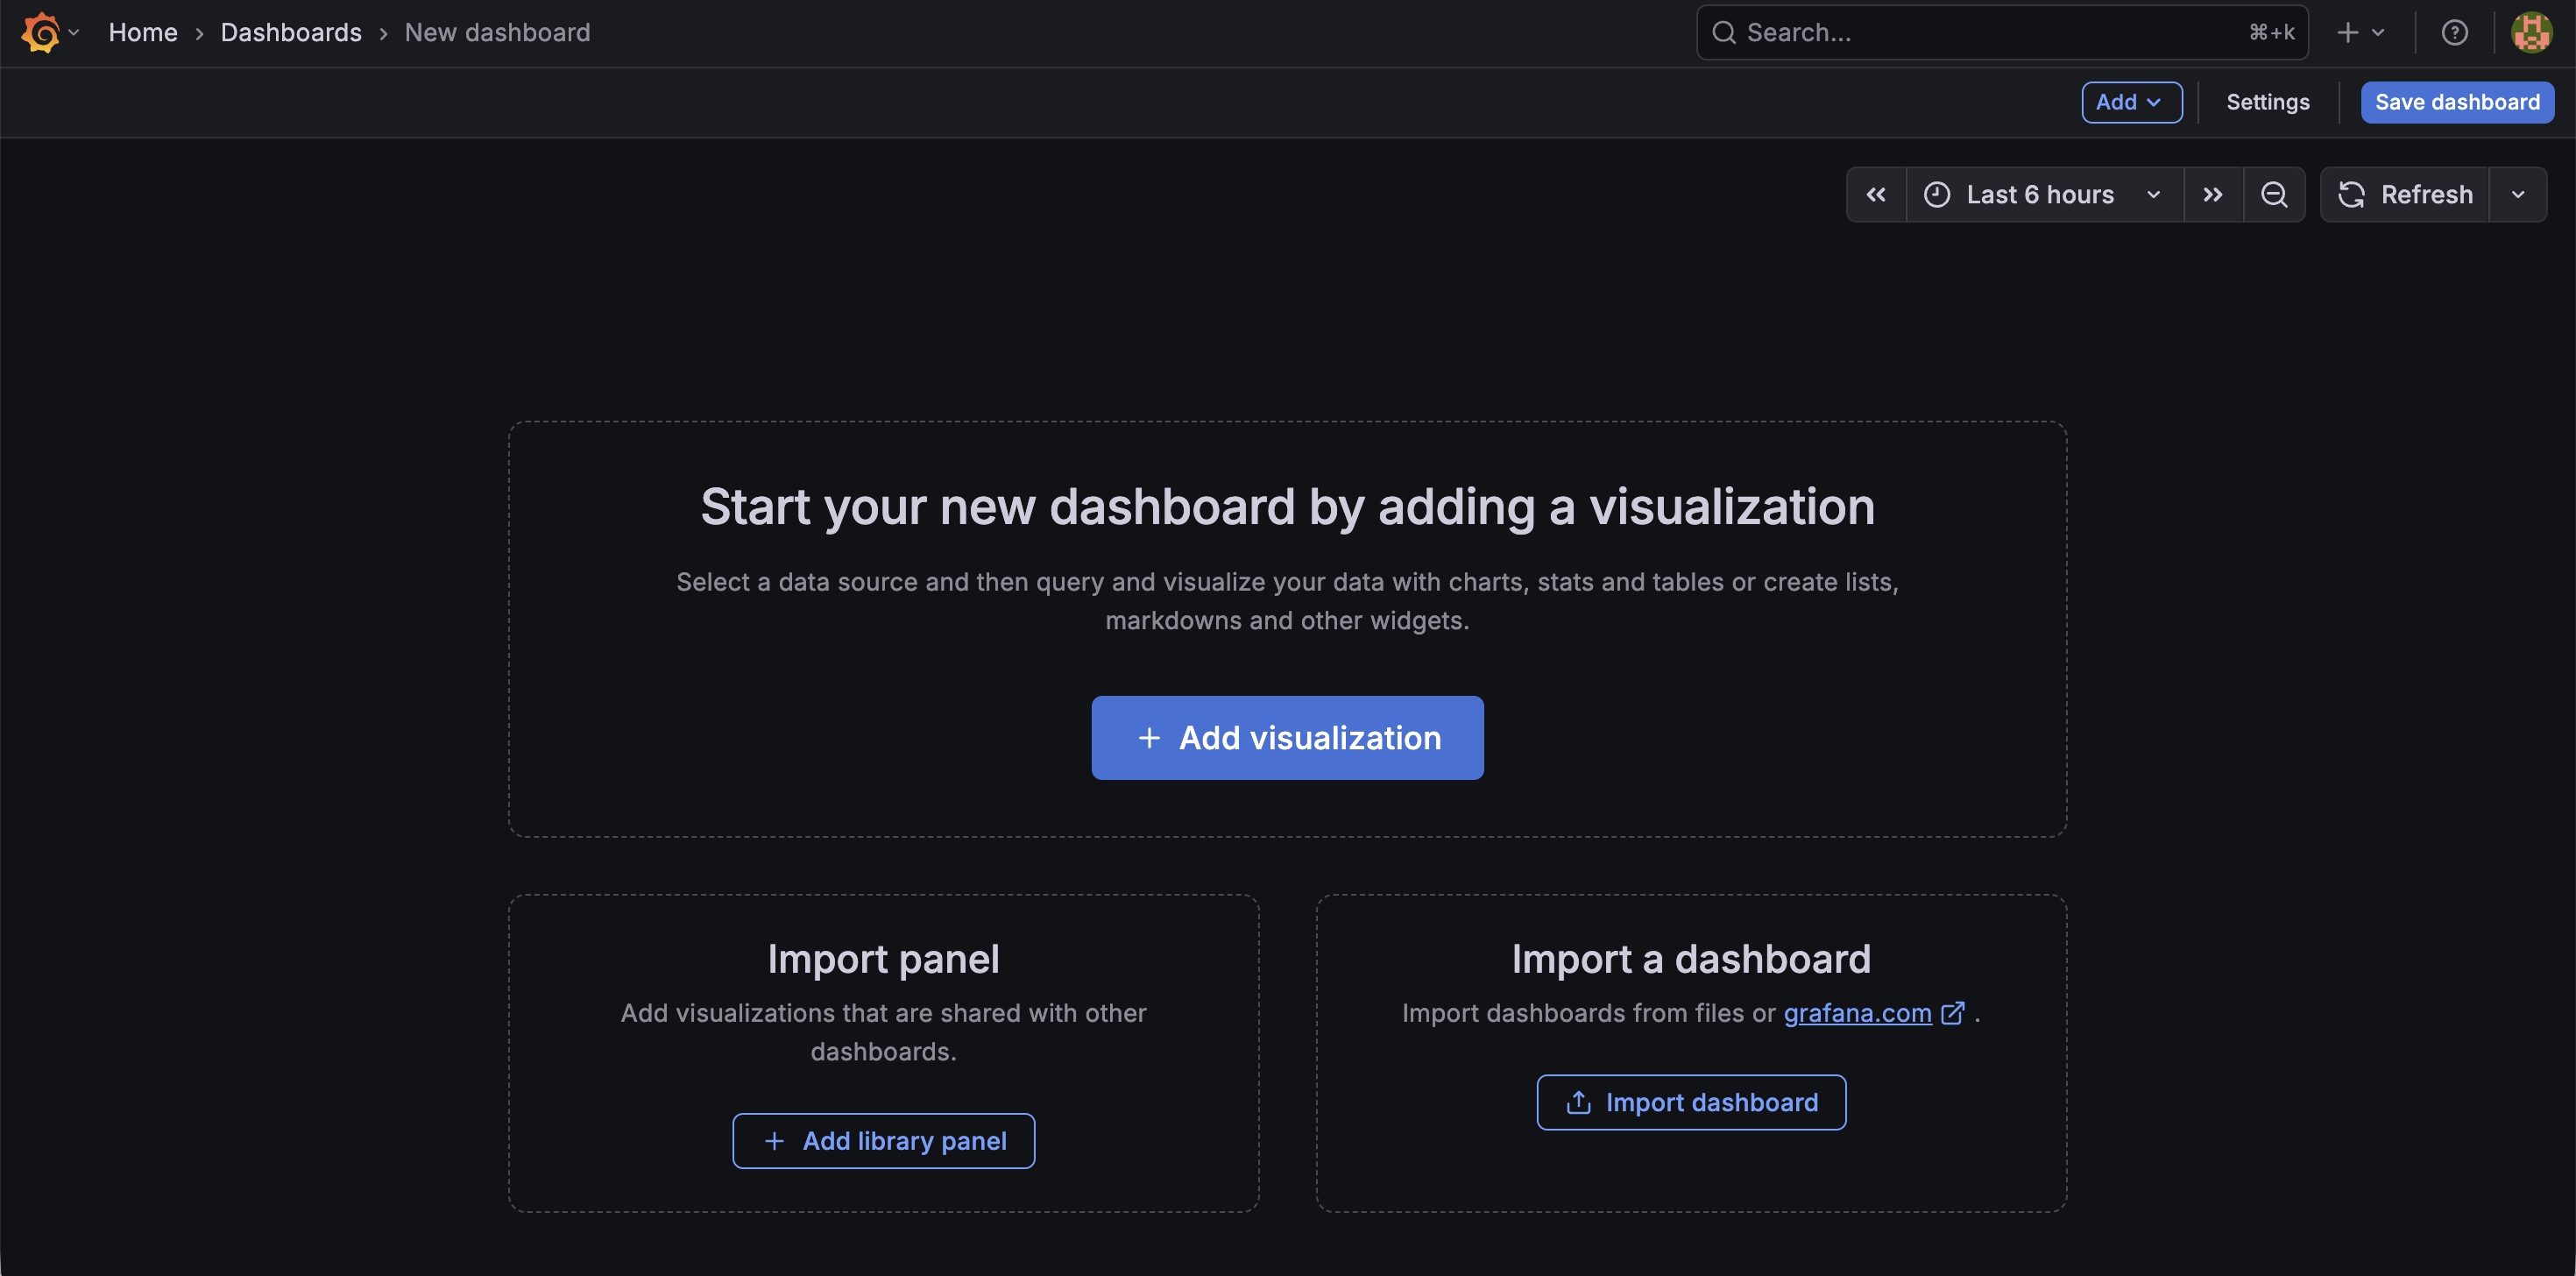
Now that the datasource is defined, we can create a dashboard.
For this, first select any metric you want in the dashboard, along with the visualisation style you want.
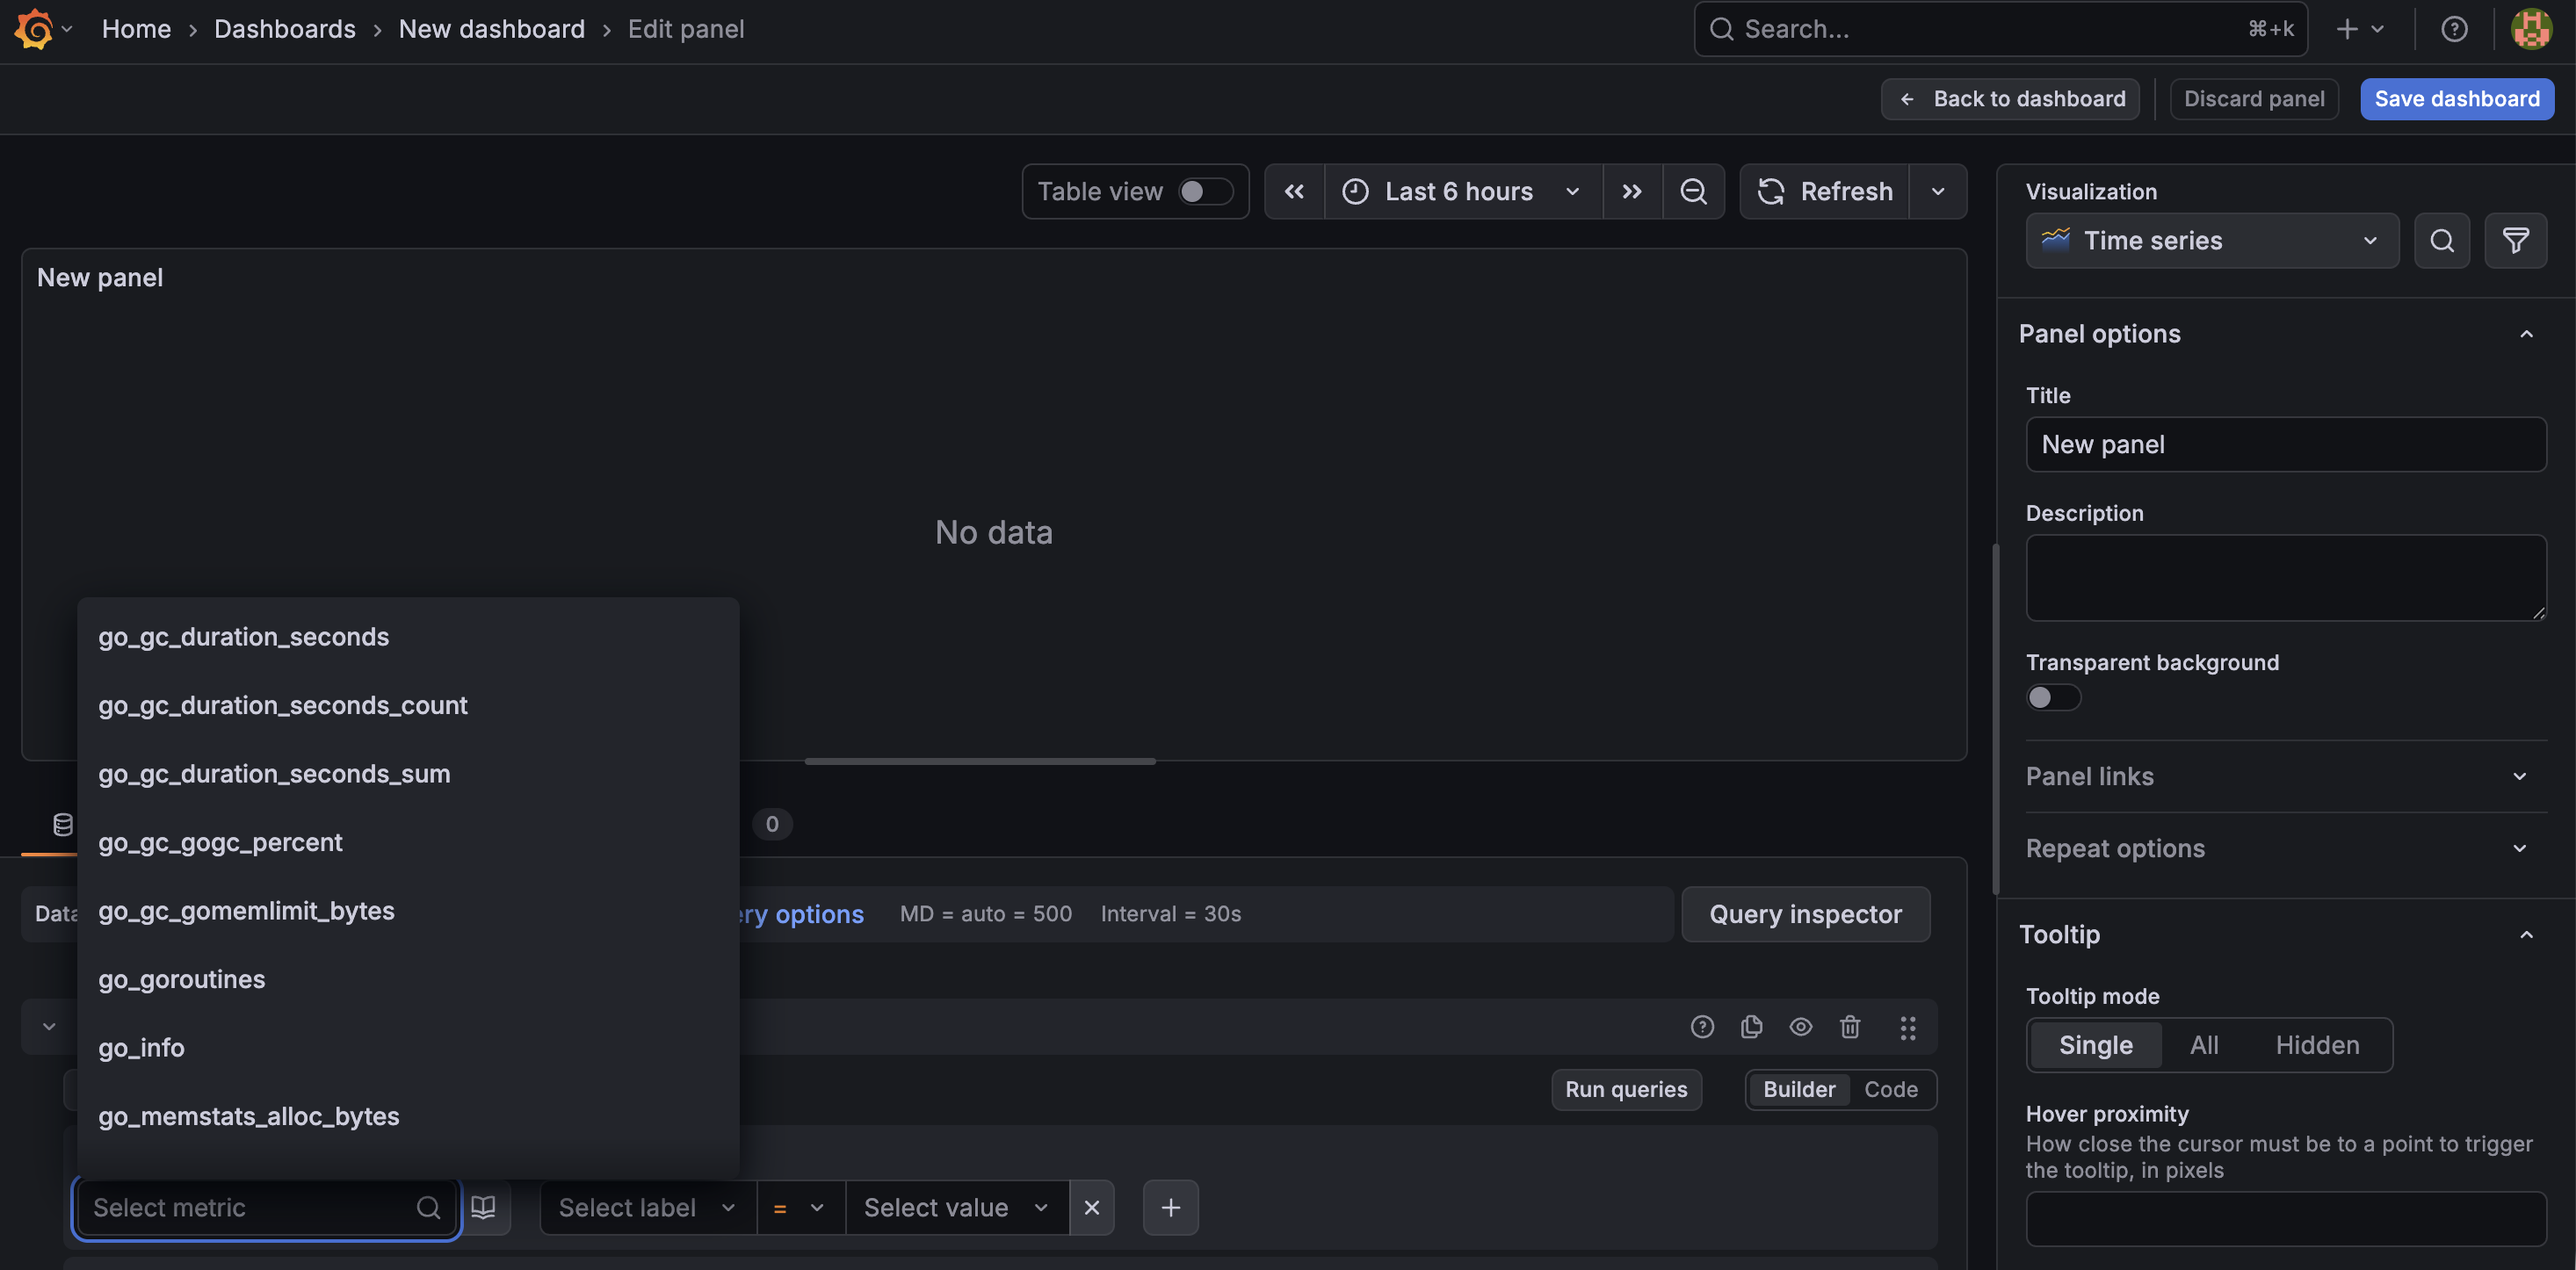
Once selected, run the query using the Run queries button, and this will give you the dashboard for that metric.
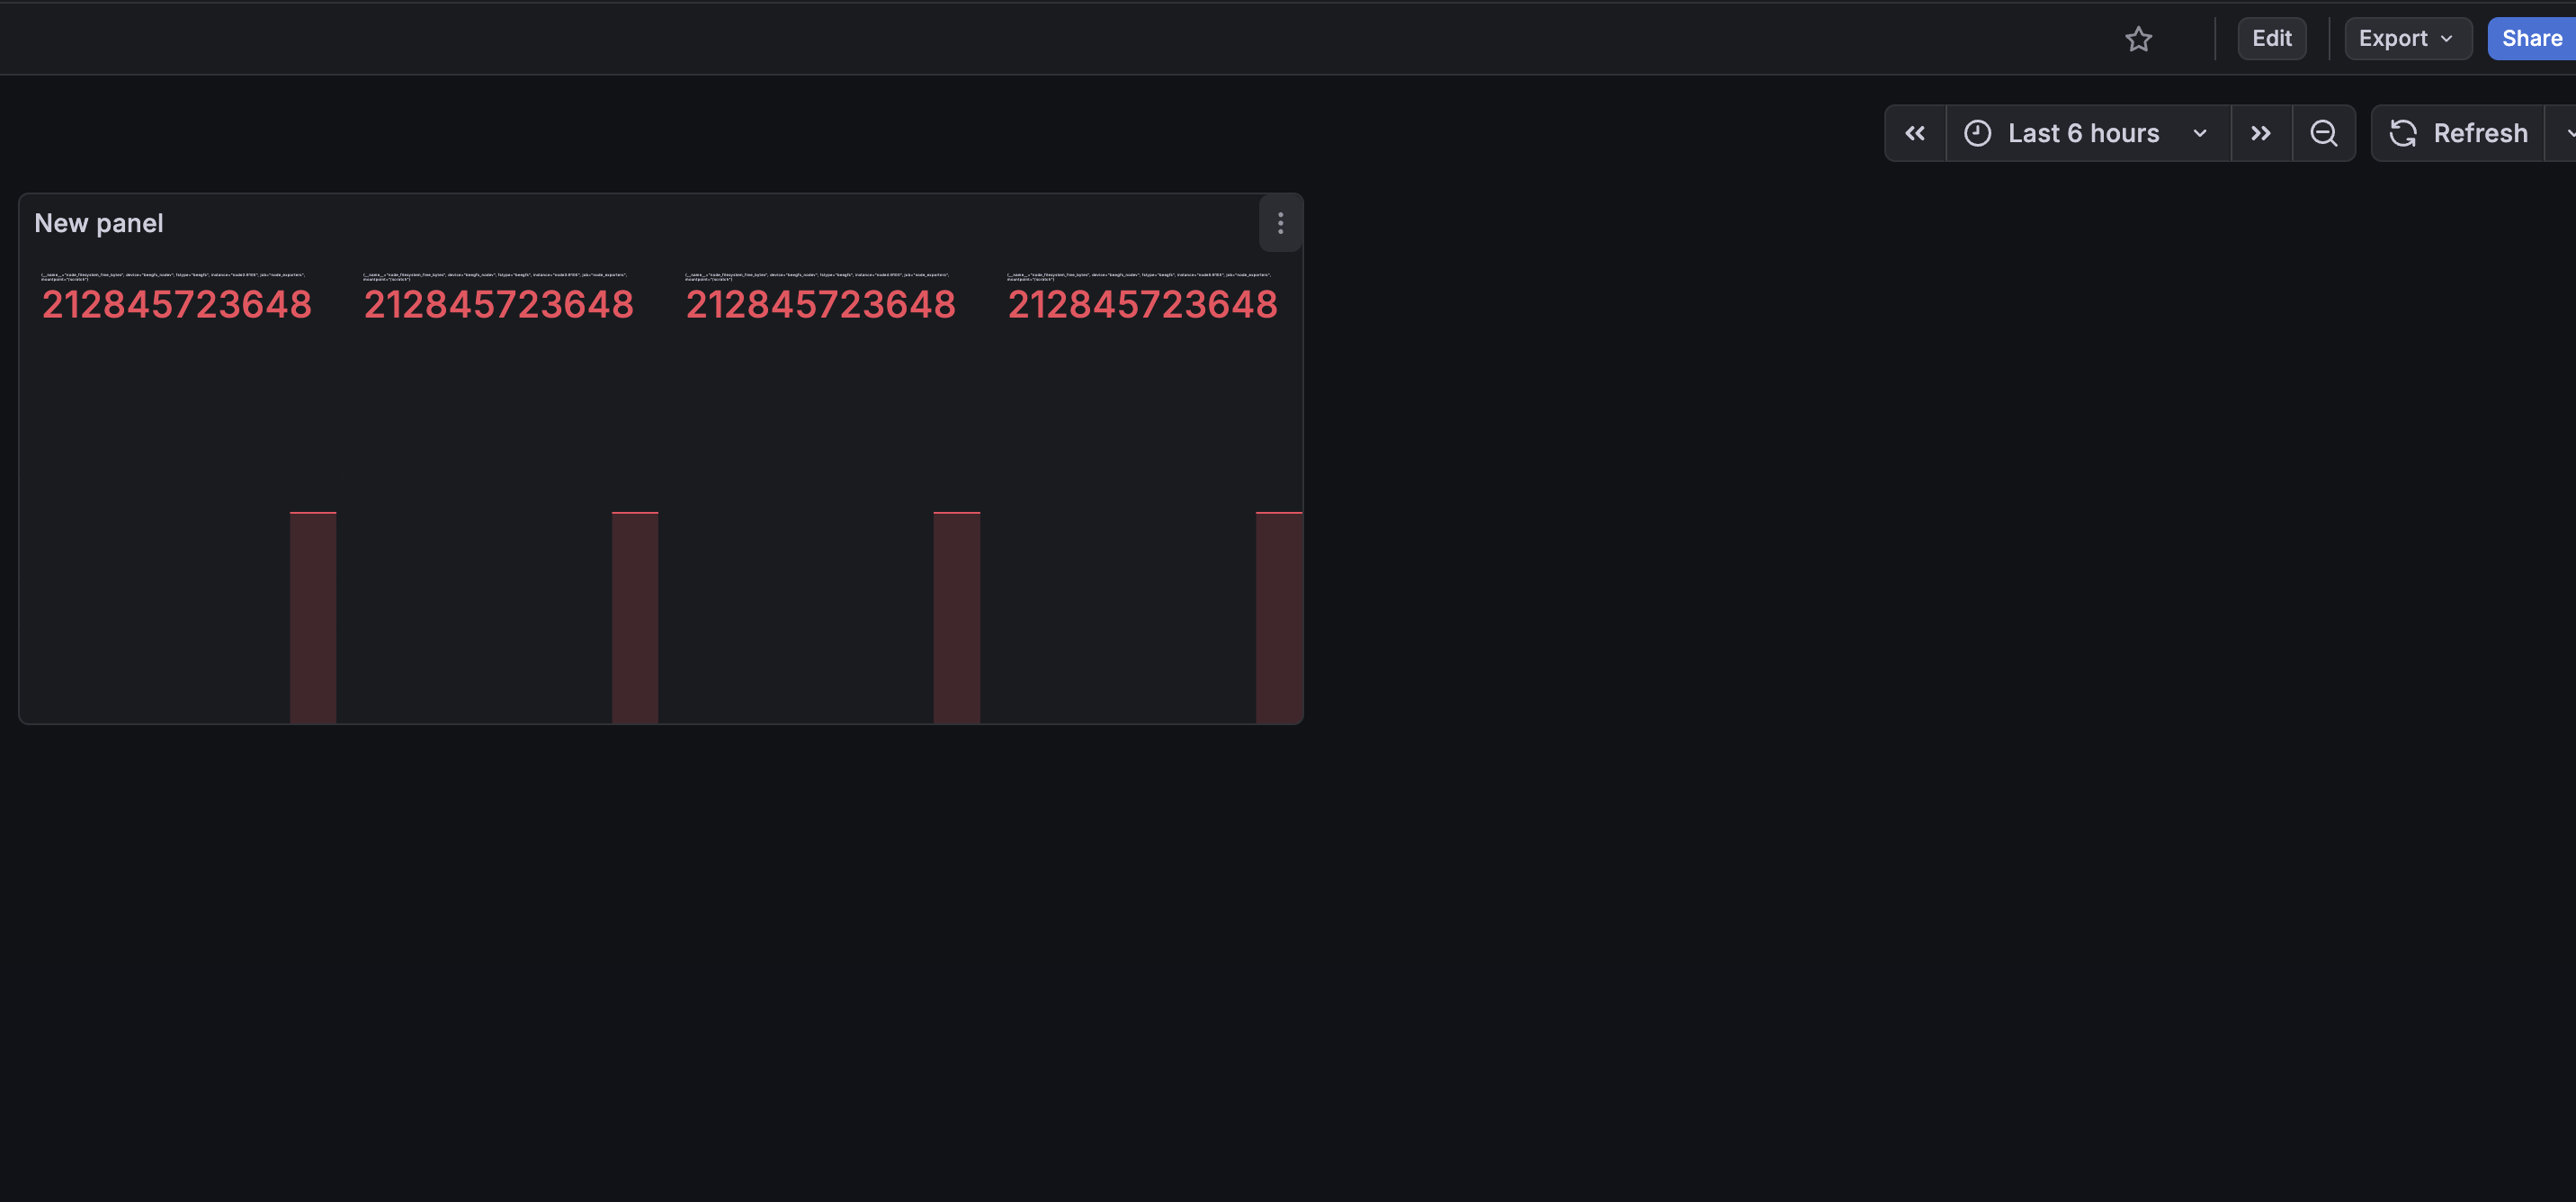
You can repeat this step for different metrics and have multiple dashboards.